French TV weather reports apparently include two new climate change graphics:
“We see it as the weather being a still image, and the climate being the film in which this image is featured,” explains Audrey Cerdan, climate editor-in-chief at France Télévisions. “If you just see the still image, but you don’t show the whole movie, you’re not going to understand the still picture.”
The first graphic shows projected global temperature rise, in Celsius, to 8 decimal places:
People watched in real time as the counter ticked over from 1.18749863 Celsius above the pre-industrial level to 1.18749864 C. Now, it’s ticking past 1.2.
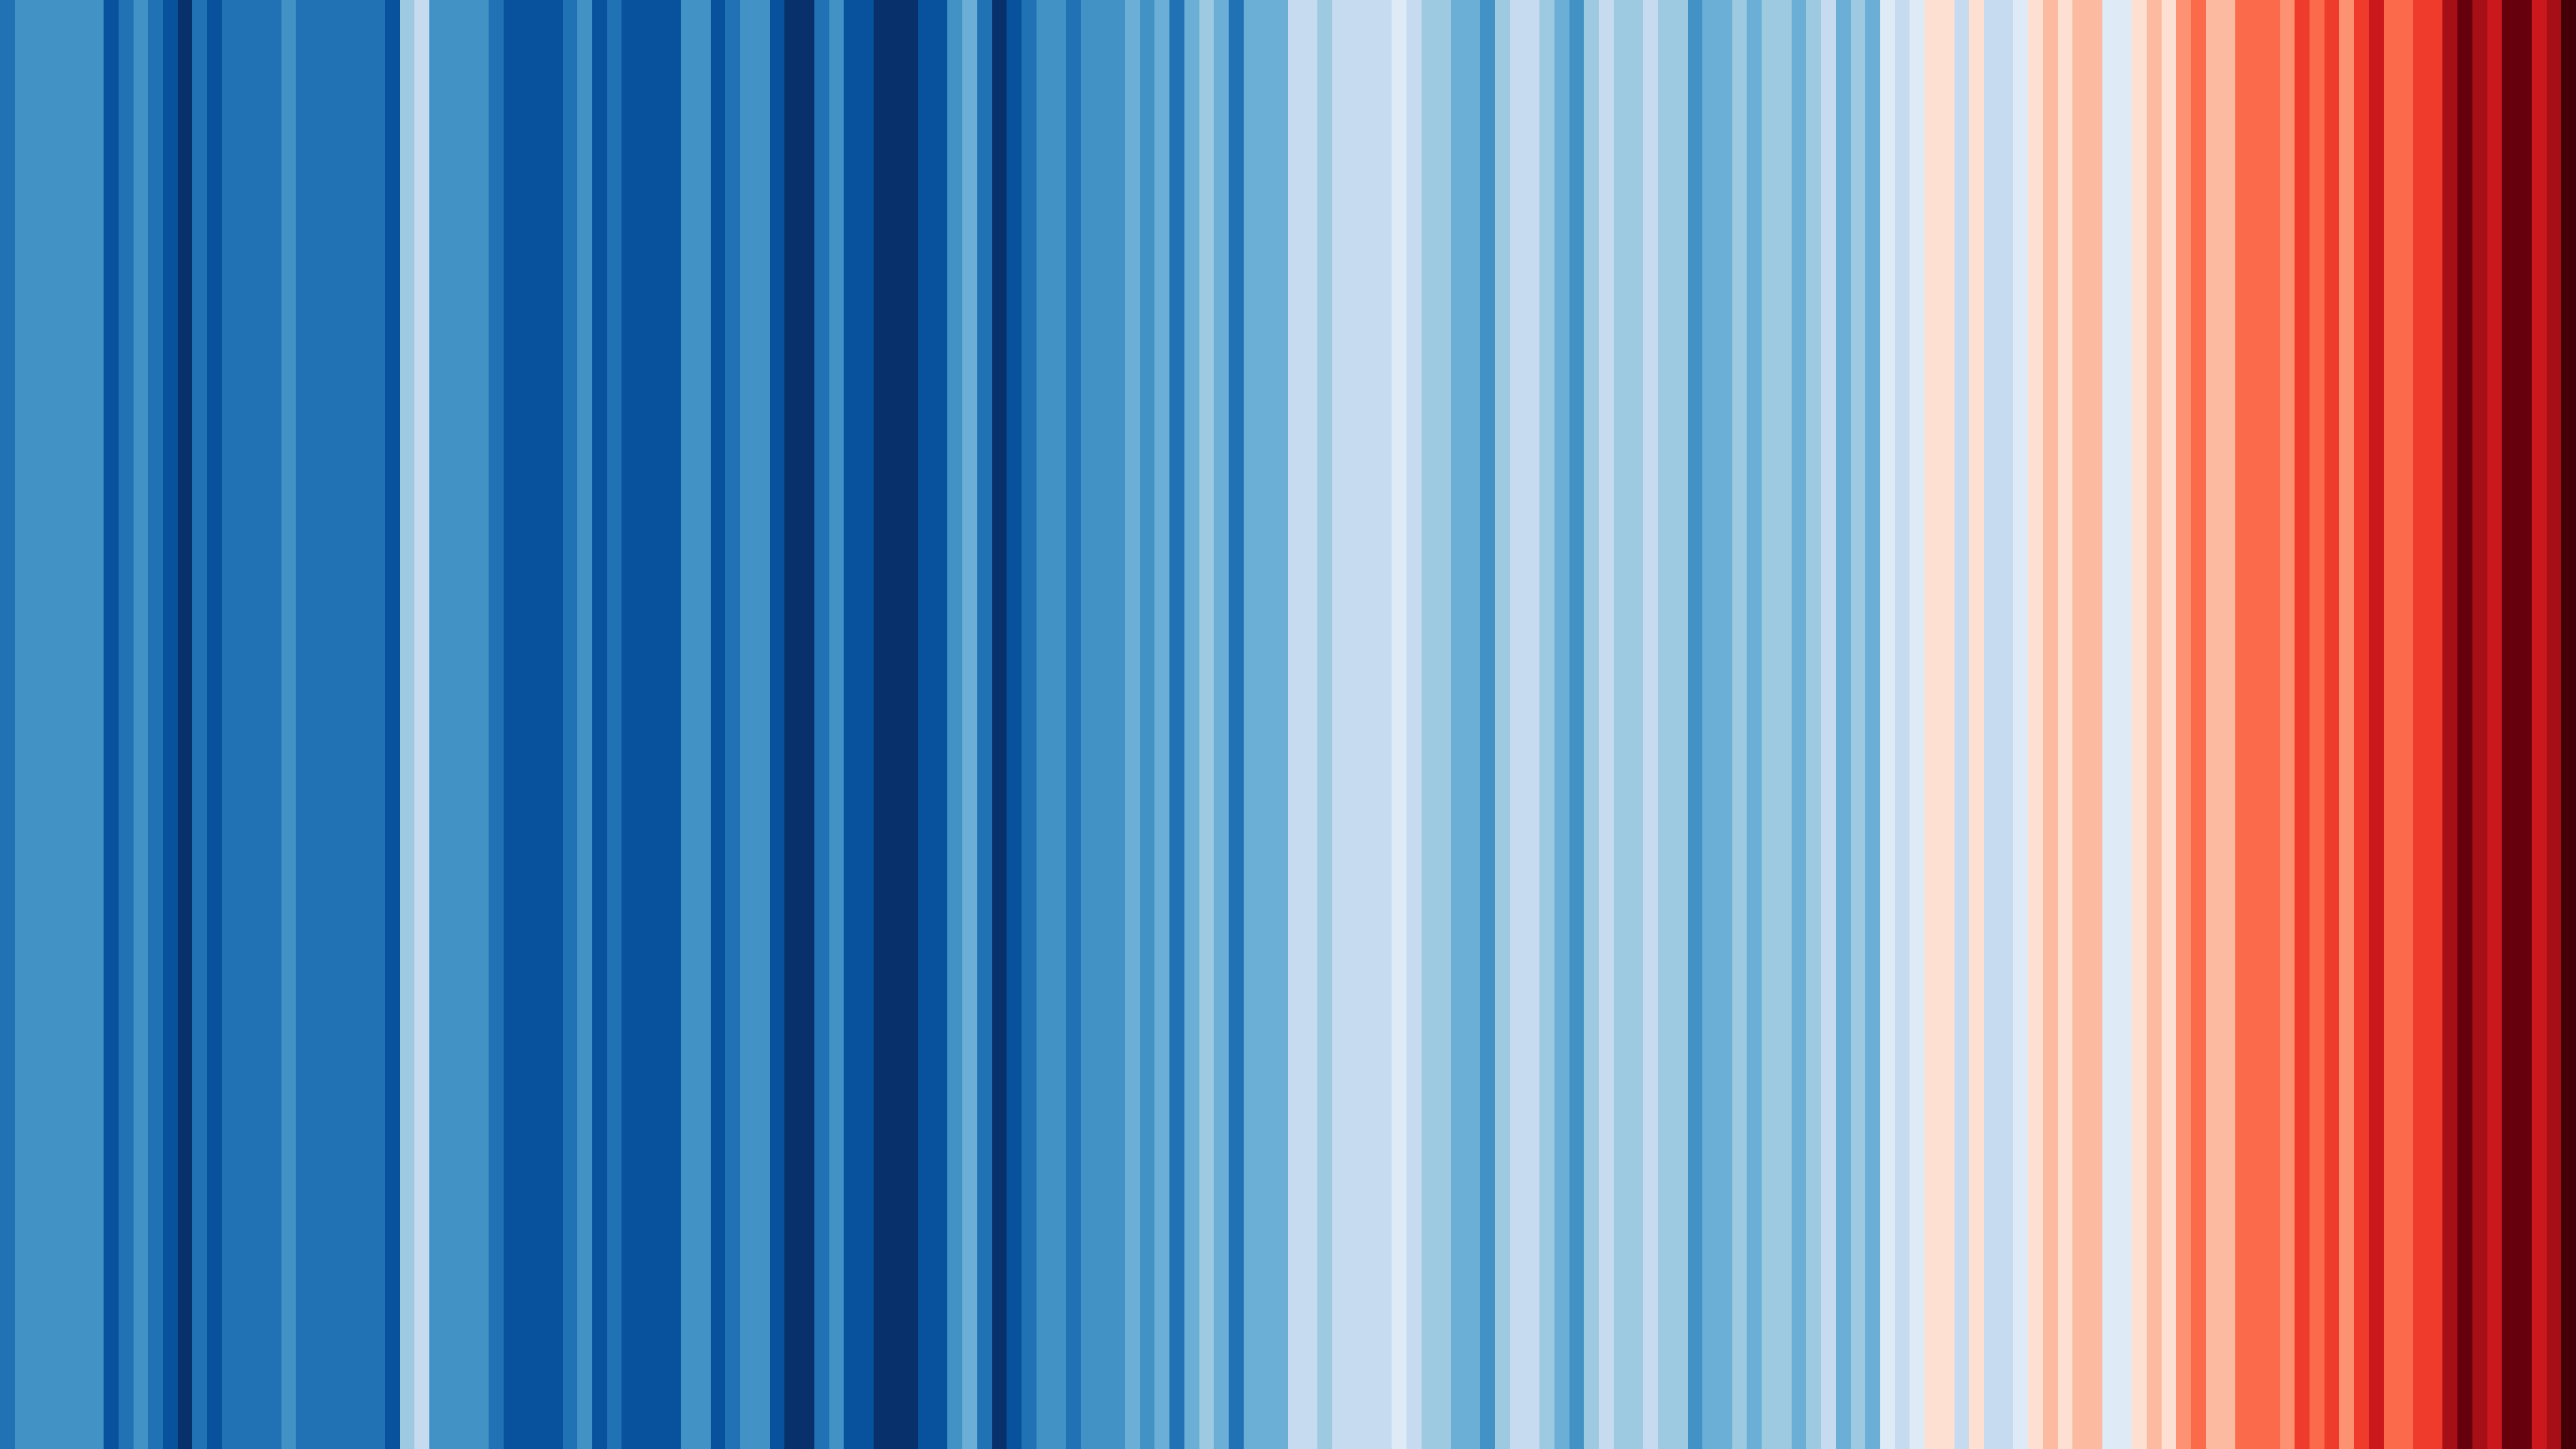
The second graphic, climate stripes, shows annual temperature rise at a glance. Here are the global stripes for 1850 through 2023:
I admire the simplicity of this visualization. I suppose it can be attacked both for its choice of color scale and for its choice of baseline average (1960 through 2010, somewhat arbitrarily) but, for a TV audience, those details seem much less important than the instinct conveyed.
I wonder what further opportunities there are to raise awareness of climate change through this combination of mass media and simple data visualization?
